
06_车道线识别–Hough变换实践
之前我们讲解了Canny边沿检测与Hough变换的原理。现在我们用Python+opencv实现Canny边沿检测,使用Hough变换将边沿检测结果标记为线条,再使用之前讲过的有效区域选取的办法将车道线用红色标记出来,Let’s Go!
OpenCV中的Hough变换用法
cv2.HoughLinesP()函数原型:
HoughLinesP(image, rho, theta, threshold, lines=None, minLineLength=None, maxLineGap=None)
- image: 必须是二值图像,推荐使用canny边缘检测的结果图像;
- rho: 线段以像素为单位的距离精度,double类型的,推荐用1.0
- theta: 线段以弧度为单位的角度精度,推荐用numpy.pi/180
- threshod: 累加平面的阈值参数,int类型,超过设定阈值才被检测出线段,值越大,基本上意味着检出的线段越长,检出的线段个数越少。根据情况推荐先用100试试
- lines:A vector that will store the parameters (r,\theta) of the detected lines,用于存储Hough变换得出的rho和theta,可以给一个空的数组,例如np.array([])
- minLineLength:线段以像素为单位的最小长度,根据应用场景设置
- maxLineGap:同一方向上两条线段判定为一条线段的最大允许间隔(断裂),超过了设定值,则把两条线段当成一条线段,值越大,允许线段上的断裂越大,越有可能检出潜在的直线段
HoughLinesP函数的输出是线的数组,每条线包含起点和终点。[[x1,y1,x2,y2],[…]]
另一种有效区域选取方式:cv2.fillPoly
以前我们学习了采用np.polyfit来画直线,然后判断某个点的位置是否在直线上方或者下方的办法确定了有效区域。现在我们有更高效也更强大的办法:cv2.fillPoly
cv2.fillPoly()函数可以用来填充任意形状的图型.可以用来绘制多边形,工作中也经常使用非常多个边来近似的画一条曲线.cv2.fillPoly()函数可以一次填充多个图型.
img = np.zeros((1080, 1920, 3), np.uint8)
area1 = np.array([[250, 200], [300, 100], [750, 800], [100, 1000]])
area2 = np.array([[1000, 200], [1500, 200], [1500, 400], [1000, 400]])

cv2.fillPoly(img, [area1, area2], (255, 255, 255))

plt.imshow(img)
plt.show()
这和我们通过多段直线去确定有效区域达到的效果是一样的,但是却简介高效得多,推荐大家使用。
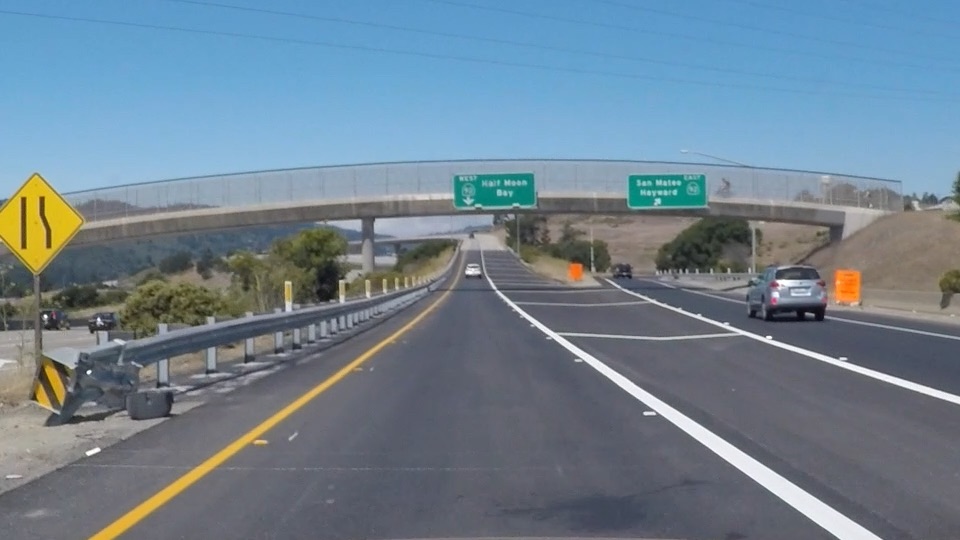
这是原始图像
最终代码:
import matplotlib.pyplot as plt
import matplotlib.image as mpimg
import numpy as np
import cv2


# Read in and grayscale the image
# Note: in the previous example we were reading a .jpg
# Here we read a .png and convert to 0,255 bytescale
image = mpimg.imread("canny-edge-detection-test.jpg")
gray = cv2.cvtColor(image,cv2.COLOR_RGB2GRAY)

# Define a kernel size and apply Gaussian smoothing
kernel_size = 5
blur_gray = cv2.GaussianBlur(gray,(kernel_size, kernel_size),0)

# Define our parameters for Canny and apply
low_threshold = 50
high_threshold = 150
edges = cv2.Canny(blur_gray, low_threshold, high_threshold)

# Next we'll create a masked edges image using cv2.fillPoly()
mask = np.zeros_like(edges)
ignore_mask_color = 255

# This time we are defining a four sided polygon to mask
imshape = image.shape
vertices = np.array([[(0,imshape[0]),(450, 290), (490, 290), (imshape[1],imshape[0])]], dtype=np.int32)
#在全0的图像上,在指定区域内填入了255
cv2.fillPoly(mask, vertices, ignore_mask_color)
#将原始图像与上面填充的图像进行按位与,感兴趣区域外的点会被置为0,感兴趣区域内的点的边沿点原本就是255,按位与之后还是255,其余点均为0
masked_edges = cv2.bitwise_and(edges, mask)


#可以试试自行调整以下参数,看看都有什么神奇的效果
# Define the Hough transform parameters
# Make a blank the same size as our image to draw on
rho = 1 # distance resolution in pixels of the Hough grid
theta = np.pi/180 # angular resolution in radians of the Hough grid
threshold = 15     # minimum number of votes (intersections in Hough grid cell)
min_line_length = 40  #minimum number of pixels making up a line
max_line_gap = 20    # maximum gap in pixels between connectable line segments
line_image = np.copy(image)*0 # creating a blank to draw lines on

# Run Hough on edge detected image
# Output "lines" is an array containing endpoints of detected line segments
lines = cv2.HoughLinesP(masked_edges, rho, theta, threshold, np.array([]),
                            min_line_length, max_line_gap)


#由于输出的只是“线条的端点集合”,所以我们要将这些点连起来,才能最终呈现我们想要的线条
# Iterate over the output "lines" and draw lines on a blank image
for line in lines:
    for x1,y1,x2,y2 in line:
        cv2.line(line_image,(x1,y1),(x2,y2),(255,0,0),10)

# Create a "color" binary image to combine with line image
#由于edges获得的只是2D的数组,每个点上的元素为一个数字,而真正的图像是每个点为[R,G,B]的数组,要想将edge图像与cv2.line输出的图像结合,需要将其转换为真正的图像,这就用到了dstack,感兴趣的同学可自行百度
color_edges = np.dstack((edges, edges, edges))

# Draw the lines on the edge image
lines_edges = cv2.addWeighted(color_edges, 0.8, line_image, 1, 0)
plt.imshow(lines_edges)
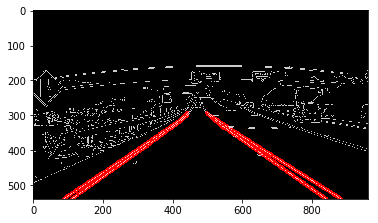
测试结果
其他
更多知识请访问我的网站vivi实验室
发表评论
Want to join the discussion?Feel free to contribute!