
07_车道线识别–从视频中提取车道线
本节是车道线识别系列的最后一个考验,之前我们的测试都是基于单张图片的,而现实生活中我们的车获取到的其实是视频流,也就是很多图片的合集。本节我们采用之前章节的知识,从视频中提取车道线并且标注在视频中。
从视频中截取图像
我们知道,视频其实是由一张一张的图像合成的,我们对车道线进行检测,需要每张图像都标记出检测到的车道线,再把这些图像组合成视频就是我们想要的结果。
Moviepy
python中处理图像一个比较好用的工具就是moviepy,这个moviepy属于imageio库,需要先安装imageio库。moviepy也是基于ffmpeg,如果没有安装ffmpeg,moviepy会在第一次使用moviepy的时候自动下载安装ffmpeg。
moviepy按帧截取视频-VideoFileClip
# Import everything needed to edit/save/watch video clips
import imageio
imageio.plugins.ffmpeg.download()

from moviepy.editor import VideoFileClip
test_clip = VideoFileClip("test.mp4")
这时得出的test_clip就是一个图像序列,可以支持我们逐帧操作了
new_clip = test_clip.fl_image(lines_detection) #NOTE: this function expects color images!!
fl_image(image_func, apply_to=[])
Modifies the images of a clip by replacing the frame get_frame(t) by another frame, image_func(get_frame(t))
其中“new_clip”是处理后的图像序列,“lines_detection”是我们针对每一帧的图像进行处理的函数名称。
new_clip.write_videofile('lines_output.mp4', audio=False)
以上代码将处理后的图像序列组成视频,完成我们的目标。
lines_detection函数
def lines_detection(image):
    gray=rgb2gray(image)
#     print(gray[650][270:340])
#     gray = cv2.cvtColor(image,cv2.COLOR_RGB2GRAY)
    # Define a kernel size and apply Gaussian smoothing
    kernel_size = 5
    blur_gray = cv2.GaussianBlur(gray,(kernel_size, kernel_size),0)

    # Define our parameters for Canny and apply
    low_threshold = 60
    high_threshold = 210
    edges = cv2.Canny(blur_gray, low_threshold, high_threshold)

    # Next we'll create a masked edges image using cv2.fillPoly()
    mask = np.zeros_like(edges)
    ignore_mask_color = 255

    # This time we are defining a four sided polygon to mask
    imshape = image.shape
    vertices = np.array([[(200,650),(630, 430), (730, 430), (1120,650)]], dtype=np.int32)
    #在全0的图像上,在指定区域内填入了255
    cv2.fillPoly(mask, vertices, ignore_mask_color)
    #将原始图像与上面填充的图像进行按位与,感兴趣区域外的点会被置为0,感兴趣区域内的点的边沿点原本就是255,按位与之后还是255,其余点均为0
    masked_edges = cv2.bitwise_and(edges, mask)


    #可以试试自行调整以下参数,看看都有什么神奇的效果
    # Define the Hough transform parameters
    # Make a blank the same size as our image to draw on
    rho = 1 # distance resolution in pixels of the Hough grid
    theta = np.pi/180 # angular resolution in radians of the Hough grid
    threshold = 15     # minimum number of votes (intersections in Hough grid cell)
    min_line_length = 50  #minimum number of pixels making up a line
    max_line_gap = 50    # maximum gap in pixels between connectable line segments
    line_image = np.copy(image)*0 # creating a blank to draw lines on

    # Run Hough on edge detected image
    # Output "lines" is an array containing endpoints of detected line segments
    lines = cv2.HoughLinesP(masked_edges, rho, theta, threshold, np.array([]),
                                min_line_length, max_line_gap)


    #由于输出的只是“线条的端点集合”,所以我们要将这些点连起来,才能最终呈现我们想要的线条
    # Iterate over the output "lines" and draw lines on a blank image
    for line in lines:
        for x1,y1,x2,y2 in line:
            if abs(y2-y1)> 25 :
                cv2.line(image,(x1,y1),(x2,y2),(255,0,0),10)

    # Create a "color" binary image to combine with line image
    #由于edges获得的只是2D的数组,每个点上的元素为一个数字,而真正的图像是每个点为[R,G,B]的数组,要想将edge图像与cv2.line输出的图像结合,需要将其转换为真正的图像,这就用到了dstack,感兴趣的同学可自行百度
#     color_edges = np.dstack((edges, edges, edges))

#     # Draw the lines on the edge image
#     lines_edges = cv2.addWeighted(color_edges, 0.8, line_image, 1, 0)
    return image
眼尖的同学可能会注意到我们这次处理车道线检测的几个区别:
1. 重写了rgb2gray
2. 梯形感兴趣区域
3. 调整了Canny边沿检测的参数以及Hough变换的参数
4. 在画线时增加了Y1 Y差值的判断
为啥要做这些调整呢?这就需要从我们之前这种检测方法说起了
基于色彩固定阈值检测方法的问题
在实际操作过程中,我们发现我们之前的代码在很多场景下并不完善,例如这个视频中有一段白色的地面。上面有黄色的车道线。按照我们之前的代码,在这个时候会检测到横着的线条,同时过滤掉了左边的黄色车道线。
白色地面的场景
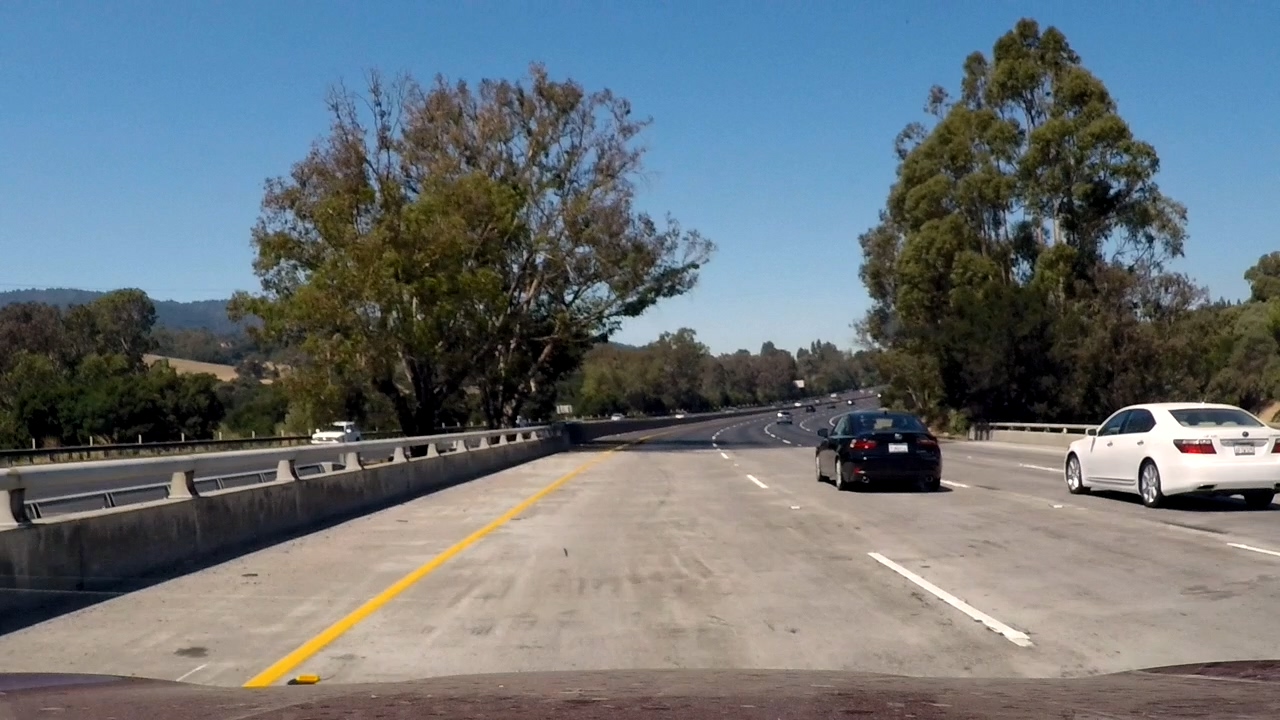
白色地面的检测结果
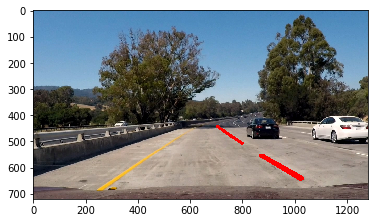
为什么会出现这种问题呢?我们怀疑是这个线条两边的对比度不够导致的,让我们看一看canny算法输入的灰度图像:
白色地面在灰度图中的结果
从上面的图像中我们可以看出转换成灰度图之后确实黄色的车道线与地面差不多亮度,这个是很难区分出来的。
道路颜色变化导致边沿误检测
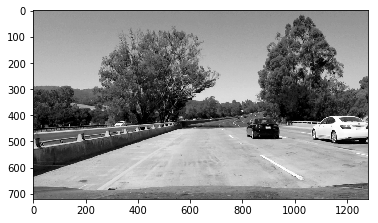
重写RGB2GRAY函数
def rgb2gray(rgb):
#     return np.dot(rgb[...,:3], [0.299, 0.587, 0.114])#自带的cv2.cvtColor(image,cv2.COLOR_RGB2GRAY)默认的变换参数
     return np.dot(rgb[...,:3], [0.9 ,0.099, 0.001]).astype(np.uint8)
由于车道线是黄色的,而纯黄色的RGB值分别是[255,255,0],因此转换成灰度图应该尽量增大R和G的比重,减小B的比重。这是我的思路,这个数值也是不断调整摸索出来的。
两种RGB2GRAY结果的对比
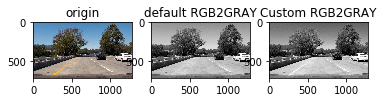
从上图我们可以明显看到重写函数之后黄色车道线的对比度明显增强,可以支持我们检测
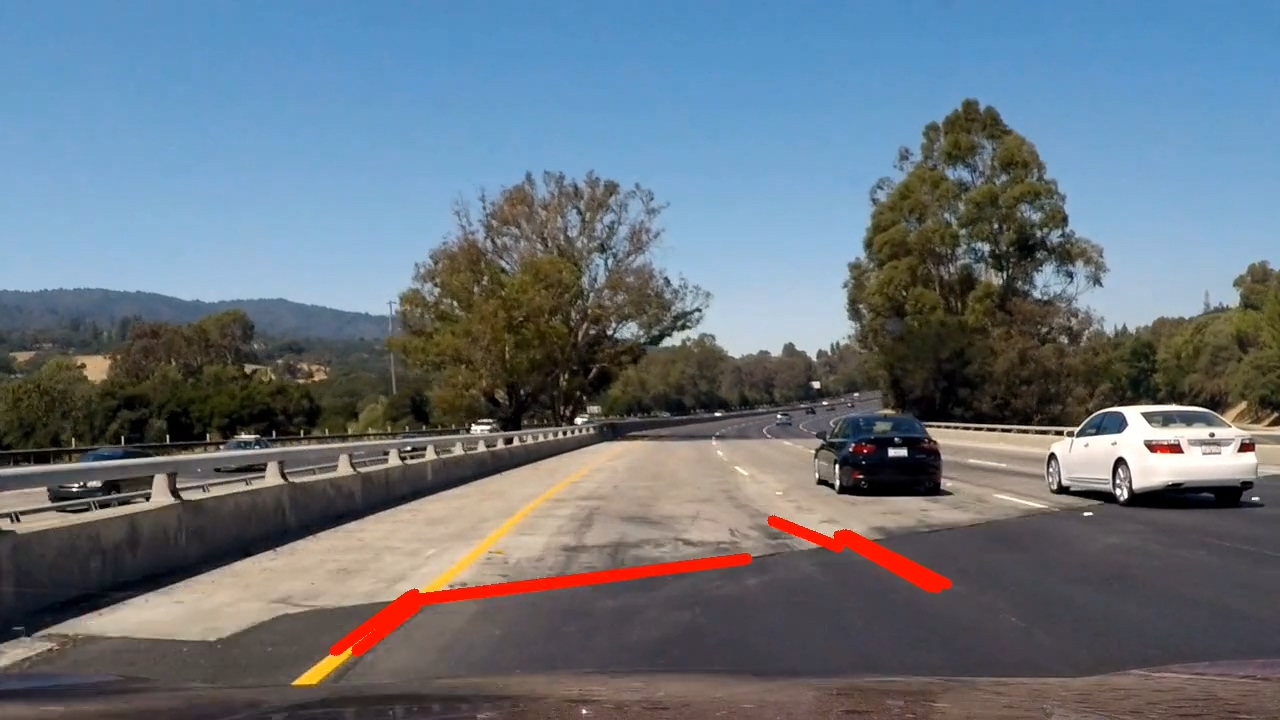
最终结果
总结
我们必须要意识到现实生活中的场景会比这个视频中的图像更复杂,单纯依靠色彩来检测车道线我们需要更好的办法。
发表评论
Want to join the discussion?Feel free to contribute!