
01_车道线识别–色彩识别
图像是人类进行驾驶时最重要的感知输入,对计算机而言,图像是一些数字的集合,如何让计算机像人类一样去感知图像是自动驾驶的一大关键点。本文将从最基础的图像基础,通过挑选色彩来识别车道线,让大家感受一下图像处理的基本知识。
图像基础-RGB
图像其实是像素点的集合,而像素点又是由【红/绿/蓝】三原色组成
百度百科引用:
三原色光模式(英语:RGB color model),又称RGB颜色模型或红绿蓝颜色模型,是一种加色模型,将红(Red)、绿(Green)、蓝(Blue)三原色的色光以不同的比例相加,以产生多种多样的色光。

RGB数值具体代表什么
每个像素由三原色来表示,在程序中常采用8位数表示三种原色各自的强度
百度百科:
灰度数字图像是每个像素只有一个采样颜色的图像。这类图像通常显示为从最暗黑色到最亮的白色的灰度,尽管理论上这个采样可以任何颜色的不同深浅,甚至可以是不同亮度上的不同颜色。灰度图像与黑白图像不同,在计算机图像领域中黑白图像只有黑白两种颜色,灰度图像在黑色与白色之间还有许多级的颜色深度。
8位数值范围是0-255,0即表示最弱,255表示最深
如下示例
| R | G | B | 颜色 |
|---|---|---|---|
| 0 | 0 | 0 | 纯黑色 |
| 0 | 0 | 255 | 纯蓝色 |
| 0 | 255 | 0 | 纯绿色 |
| 255 | 0 | 0 | 纯红色 |
| 255 | 255 | 255 | 纯白色 |
问题:如何有效找出车道线?
如下图片中,车道线最显著的特征是什么呢?

通过观察我们可以发现,车道线呈接近白色,如果我们可以筛选一下颜色,就可以得到一个相对“干净”的画面便于我们处理
筛选出“白色”
import matplotlib.pyplot as plt
import matplotlib.image as mpimg
import numpy as np
from PIL import Image
from numpy import array

# Read in the image and print out some stats
# 在python3+windows10下面,matplotlib只能读取png格式的文件,所以换成pillow
# image = mpimg.imread('ColorSelectionTest.png')
image_P = Image.open('ColorSelectionTest.jpg')
print('This image is: ',type(image_P),
         'with dimensions:', image_P.size)

image=array(image_P)

# Grab the x and y size and make a copy of the image
ysize = image.shape[0]
xsize = image.shape[1]
# Note: always make a copy rather than simply using "="
color_select = np.copy(image)

print(color_select[1])

# 以下的threshold你可以自己进行调整测试,会很有意思

red_threshold = 220
green_threshold = 220
blue_threshold = 220
rgb_threshold = [red_threshold, green_threshold, blue_threshold]

# Identify pixels below the threshold
thresholds = (image[:,:,0] < rgb_threshold[0]) \
            | (image[:,:,1] < rgb_threshold[1]) \
            | (image[:,:,2] < rgb_threshold[2])
color_select[thresholds] = [0,0,0]

# Display the image
plt.imshow(color_select)
plt.show()
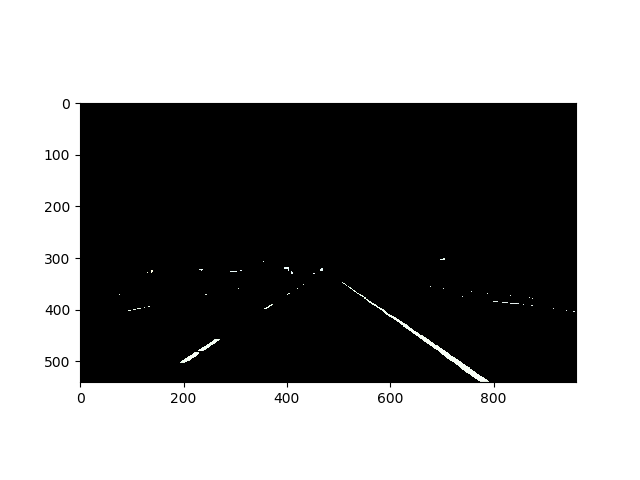
最终成果:
220为阈值

180为阈值

读者可以试着自己修改以上代码运行,修改threshold数值看看有什么变化,思考一下为什么
彩蛋:thresholds的赋值
在以上代码中有一段很有意思
# Identify pixels below the threshold
thresholds = (image[:,:,0] < rgb_threshold[0]) \
            | (image[:,:,1] < rgb_threshold[1]) \
            | (image[:,:,2] < rgb_threshold[2])

print(len(thresholds))
print(len(thresholds[0]))


color_select[thresholds] = [0,0,0]
首先看一下thresholds是怎么被赋值的
image是一个[540,960,3]的数组,540/960分别代表图片的高/长,3就是每个像素点的[R/G/B]三色各自的值
thresholds = (image[:,:,0] < rgb_threshold[0]) \
            | (image[:,:,1] < rgb_threshold[1]) \
            | (image[:,:,2] < rgb_threshold[2])
得到了一个[540×960]的二维数组,image中每个像素点的R/G/B任意一个值小于所设置的对应阈值,该数组下标的值都会设置为True
再通过
color_select[thresholds] = [0,0,0]
将图片中挑选出的thresholds数组中标记为True的点全部设置为黑色,其他点保留颜色,由此可以得出筛选后的图片
发表评论
Want to join the discussion?Feel free to contribute!